in data, not all variables are create equal. Sometimes, we encounter data with a natural order, where categories hold inherent meaning beyond just simple labels. This is where ordinal logistic regression steps in, a powerful technique designed to handle these ordered categorical variables. This comprehensive guide delves into the world of ordinal logistic regression in Python, equipping you to model the relationship between features and an ordinal response variable, enabling you to predict the most likely category for a new data point.
What is Ordinal Data?
Ordinal data refers to a type of categorical variable where the categories have a natural order or ranking. Unlike nominal data (where categories are simply labels without inherent order), ordinal data conveys a sense of progression or hierarchy. Here are some examples:
- Customer satisfaction ratings (Very Satisfied, Satisfied, Neutral, Dissatisfied)
- Movie reviews (5 stars, 4 stars, 3 stars, 2 stars, 1 star)
- Education levels (Doctorate, Master’s, Bachelor’s, Associate’s, High School Diploma)
Why Ordinal Logistic Regression?
While traditional classification algorithms can be used for these types of data, they treat each category as independent, ignoring the inherent order. Ordinal logistic regression capitalizes on this order, leading to more accurate and informative models. It allows us to estimate the probability of a data point belonging to a specific category within the ordered sequence.
Core Concepts of Ordinal Logistic Regression
The Underlying Model:
Ordinal logistic regression builds upon the principles of logistic regression. It models the probability of a data point belonging to a particular category (or above) in the ordered sequence. Here’s a breakdown of the key concepts:
- Proportional Odds: This assumption lies at the heart of ordinal logistic regression. It states that the effect of a predictor variable on the log-odds of being in a higher category compared to all lower categories is constant across all categories.
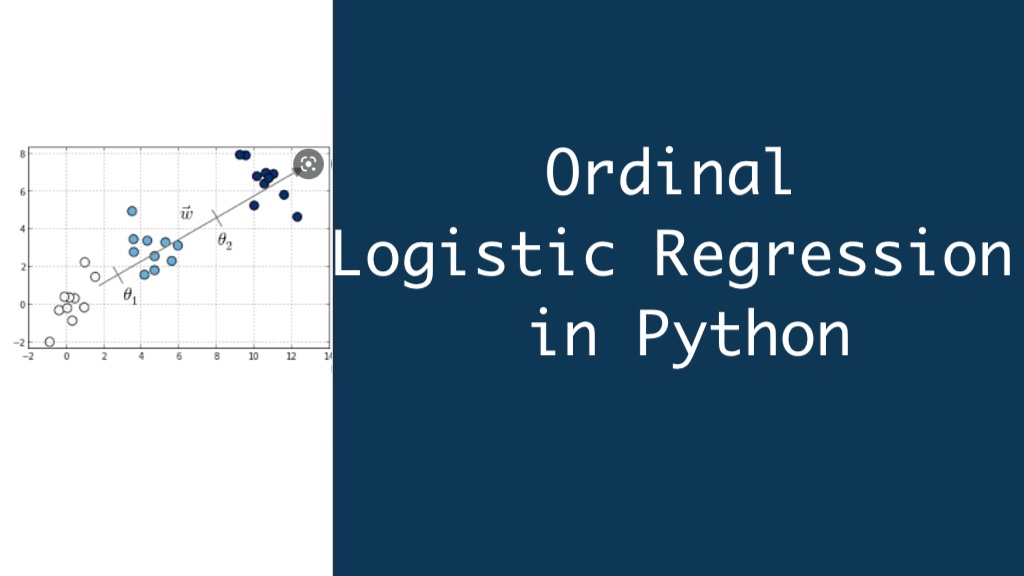
- Thresholds: Ordinal logistic regression uses a set of thresholds (also called cutpoints) to differentiate between the ordered categories. These thresholds estimate the change in the log-odds of being in a higher category compared to all lower categories.
- Link Function: Similar to logistic regression, ordinal logistic regression employs a link function (often the logit link) to connect the linear combination of features to the probability of belonging to a specific category or above.
Building the Model: Implementation in Python
Let’s embark on a practical journey by implementing ordinal logistic regression in Python using the statsmodels library:
import pandas as pd
from statsmodels.miscmodels.ordinal_model import OrderedModel

# Load your data (replace with your actual data)
data = pd.read_csv("your_data.csv")

# Define the dependent (ordinal) variable and independent features
dependent_variable = "customer_satisfaction"
independent_features = ["product_rating", "price"]

# Create the OrdinalModel object
model = OrderedModel(data[dependent_variable], data[independent_features])

# Fit the model to the data
results = model.fit()

# Print the model summary
print(results.summary())

# Make predictions on new data (replace with your actual data)
new_data = {"product_rating": 4, "price": 200}
predicted_category = results.predict(new_data)[0]

# Print the predicted category
print("Predicted customer satisfaction level:", predicted_category)
Explanation of the Code:
- Data Loading and Preparation: We import the necessary libraries, load your data into a pandas DataFrame, and define the dependent (ordinal) variable and independent features.
- Model Creation: We create an
OrderedModelobject from thestatsmodelslibrary, specifying the dependent variable and independent features. - Model Fitting: The
fitmethod trains the model on the data. - Model Summary: The model summary provides insights into the coefficients, significance levels, and overall fit of the model.
- Prediction: We create a new data point with desired feature values and use the
predictmethod to predict the most likely category for that data point.
Remember: Replace placeholders like “your_data.csv” and new data values with your actual data before running the code.
Interpreting the Results: Unveiling Insights
Once you’ve trained your model, how do you interpret the results? Here are some key aspects to consider:
- Model Coefficients: Similar to logistic regression, ordinal logistic regression provides coefficients for each independent variable. These coefficients indicate the direction and strength of the relationship between the feature and the log-odds of being in a higher category compare to all lower categories. A positive coefficient suggests that an increase in the feature value is associate with a higher predicte category (e.g., higher product rating might lead to higher predicted customer satisfaction).
- Significance Levels: P-values associated with the coefficients indicate their statistical significance. A low p-value suggests that the relationship between the feature and the outcome is statistically significant.
- Thresholds: Ordinal logistic regression estimates a set of thresholds that separate the ordered categories. These thresholds can be interprete as the points on the linear combination of features where the model predicts a switch in category.
- Overall Model Fit: Various metrics like AIC (Akaike Information Criterion) and BIC (Bayesian Information Criterion) can be use to compare different ordinal logistic regression models and assess their overall fit to the data.
Additional Considerations:
- Proportional Odds Assumption: It’s crucial to check if the proportional odds assumption holds for your data. Techniques like score tests can be use for this purpose. If the assumption is violate, alternative models like multinomial logistic regression might be necessary.
- Number of Thresholds: Ordinal logistic regression typically estimates one less threshold than the number of categories. This is because the lowest category is implicitly define by the absence of any threshold being cross.
Considerations and Best Practices
Data Preprocessing:
- Handling Missing Values: Missing values can impact the model’s performance. Techniques like imputation or removing rows with missing data can be employe.
- Feature Engineering: Feature engineering can improve model performance. Consider creating new features that capture interactions between existing ones.
Model Selection and Evaluation:
- Model Selection: Explore different model specifications (e.g., different link functions) and compare their performance using metrics like AIC or BIC.
- Evaluation: Evaluate the model’s performance on unseen data using techniques like cross-validation. Metrics like accuracy or confusion matrix can be use, but keep in mind that they might not fully capture the ordinal nature of the data.
Remember: Ordinal logistic regression is a powerful tool for analyzing ordered categorical data. By understanding the core concepts, implementation details, and interpretation techniques, you can build informative models that unlock valuable insights from your data.
Advantages Ordinal Logistic Regression
Ordinal logistic regression offers several advantages over traditional classification approaches for ordered categorical variables:
- Leverages Order: It captures the inherent order in the data, leading to more accurate and informative models compared to treating categories as independent.
- Interpretability: Coefficients and thresholds offer some interpretability regarding the relationship between features and the ordinal variable.
- Flexibility: It can handle response variables with more than two ordered categories, unlike binary logistic regression.
Applications of Ordinal Logistic Regression
- Customer Satisfaction Analysis: Predicting customer satisfaction levels based on product ratings, purchase history, or other factors.
- Risk Rating: Assessing an individual’s credit risk or insurance risk based on various variables like income, debt, and past behavior.
- Survey Analysis: Predicting survey response categories (e.g., Strongly Agree, Agree, Neutral) based on demographic information or questionnaire responses.
- Medical Diagnosis: Modeling disease severity based on symptoms or test results.
These are just a few examples, and the potential applications of ordinal logistic regression extend across diverse domains where ordered categorical data plays a crucial role.
Conclusion
Ordinal logistic regression equips you with a robust technique to navigate the world of ordered categorical data in Python. By capitalizing on the inherent order within these categories, you can build more accurate and informative models compared to traditional classification approaches. Embrace the power of ordinal logistic regression to unlock hidden patterns in your data, improve decision-making, and gain a deeper understanding of your ordered categorical variables.