Ever wondered how scientists and researchers make sense of complex data? Hypothesis testing statistics is the secret weapon. It’s a powerful tool that helps us uncover hidden truths in numbers. Let’s explore this fascinating world of data analysis together.
What is Hypothesis Testing?
Hypothesis testing is a method in statistics. It helps us make decisions about populations based on sample data. We start with a claim about a population parameter. Then we use sample data to test if the claim is likely true or not.
The process involves two hypotheses:
- Null hypothesis (H0): The initial claim we want to test
- Alternative hypothesis (H1 or Ha): The opposite of the null hypothesis
We collect data and use statistical tests to decide which hypothesis to accept. This method is widely used in science, medicine, and business.
Steps in Hypothesis Testing
Hypothesis testing follows a structured approach. Here are the main steps:
- State the hypotheses
- Choose a significance level
- Select the appropriate test statistic
- Collect data and calculate the test statistic
- Determine the p-value
- Make a decision and interpret the results
Each step is crucial for accurate results. Let’s look at them in more detail.
1. State the Hypotheses
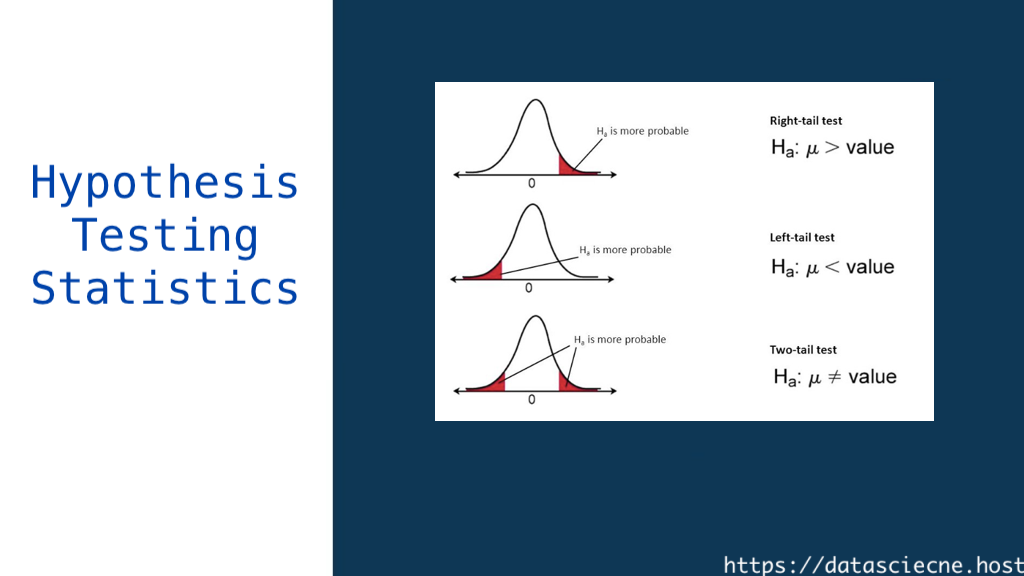
First, we clearly define our null and alternative hypotheses. The null hypothesis is usually a statement of no effect or no difference. The alternative hypothesis is what we’re trying to prove.
For example:
- H0: The mean height of adult males is 170 cm
- H1: The mean height of adult males is not 170 cm
2. Choose a Significance Level
The significance level (α) is the probability of rejecting a true null hypothesis. Common values are 0.05 and 0.01. This choice affects our decision-making process.
3. Select the Appropriate Test Statistic
We choose a test statistic based on our data and hypotheses. Common test statistics include:
- Z-test (for large samples with known population standard deviation)
- T-test (for small samples or unknown population standard deviation)
- Chi-square test (for categorical data)
- F-test (for comparing variances)
4. Collect Data and Calculate the Test Statistic
We gather our sample data and compute the test statistic. This value helps us determine how likely our sample results are, assuming the null hypothesis is true.
5. Determine the P-value
The p-value is the probability of getting results as extreme as our sample, assuming the null hypothesis is true. We compare this to our significance level.
6. Make a Decision and Interpret the Results
If the p-value is less than our significance level, we reject the null hypothesis. Otherwise, we fail to reject it. We then explain what this means in context.
Types of Hypothesis Tests
There are various types of hypothesis tests. Each serves a specific purpose. Here are some common ones:
One-Sample T-Test
This test compares a sample mean to a known population mean. It’s useful when we have a small sample size or unknown population standard deviation.
Two-Sample T-Test
We use this to compare means from two independent groups. It helps us determine if there’s a significant difference between the groups.
Paired T-Test
This test is for comparing two related groups. It’s often used in before-and-after studies.
ANOVA (Analysis of Variance)
ANOVA compares means across three or more groups. It helps us understand if there are significant differences among multiple groups.
Chi-Square Test
This test is for categorical data. It helps us determine if there’s a significant association between two categorical variables.
Common Errors in Hypothesis Testing
Even with careful analysis, errors can occur. Two main types of errors are:
Type I Error
This happens when we reject a true null hypothesis. The probability of this error is equal to our significance level (α).
Type II Error
This occurs when we fail to reject a false null hypothesis. The probability of this error is denoted by β.
Understanding these errors helps us interpret our results more accurately.
Power of a Test
The power of a test is its ability to detect an effect when one exists. It’s calculated as 1 – β. A higher power means a lower chance of Type II error.
Factors affecting test power include:
- Sample size
- Effect size
- Significance level
Increasing sample size often improves test power.
Assumptions in Hypothesis Testing
Most hypothesis tests have underlying assumptions. Common assumptions include:
- Random sampling
- Independence of observations
- Normal distribution of data
- Equal variances (for some tests)
Violating these assumptions can lead to incorrect conclusions. It’s crucial to check these before conducting a test.
Interpreting Results
Interpreting results goes beyond just p-values. We need to consider:
- Practical significance
- Effect size
- Confidence intervals
A statistically significant result doesn’t always mean practical importance. We must consider the context of our study.
Limitations of Hypothesis Testing
While powerful, hypothesis testing has limitations:
- It doesn’t prove hypotheses, only supports or rejects them
- Results can be affected by sample size
- It relies on probability, so there’s always a chance of error
- It doesn’t measure the size of an effect
Understanding these limitations helps us use hypothesis testing responsibly.
Real-World Applications
Hypothesis testing is used in many fields:
- Medicine: Testing new drugs and treatments
- Marketing: Evaluating advertising effectiveness
- Psychology: Studying human behavior
- Quality control: Ensuring product standards
These applications show the wide-ranging impact of hypothesis testing.
Tools for Hypothesis Testing
Many software tools can help with hypothesis testing:
- R: A popular language for statistical computing
- Python: With libraries like SciPy and statsmodels
- SPSS: A statistical software package
- Excel: For basic hypothesis tests
These tools make complex calculations easier and faster.
Future of Hypothesis Testing
As data science evolves, so does hypothesis testing. New trends include:
- Bayesian methods
- Machine learning integration
- Big data applications
These advancements are shaping the future of statistical analysis.
Conclusion
Hypothesis testing is a cornerstone of statistical analysis. It helps us make sense of data and draw meaningful conclusions. By understanding its principles, steps, and limitations, we can use this powerful tool effectively in various fields.
As we continue to generate more data, the importance of hypothesis testing will only grow. Whether you’re a scientist, business analyst, or curious learner, mastering this skill will serve you well in our data-driven world.