AUC and ROC curves are used check model accuracy. where algorithms grapple with distinguishing between different categories (classification tasks), evaluating their performance is crucial. Two powerful tools emerge from this quest for evaluation: the Receiver Operating Characteristic (ROC) curve and the Area Under the Curve (AUC). These concepts, along with the notion of threshold value, work in tandem to shed light on how well your classification model performs.
Imagine a medical test designed to identify a particular disease. Here’s where ROC AUC and threshold come into play:
- The Test Result Spectrum: The test result can range from a very low value (indicating a strong likelihood of being healthy) to a very high value (indicating a high probability of having the disease). This spectrum forms the foundation for the ROC curve.
- True Positives and False Positives: A true positive signifies that the test correctly identifies someone with the disease (high test result value and actual disease). Conversely, a false positive depicts an incorrect identification, where the test suggests someone has the disease when they are actually healthy (high test result value but no disease).
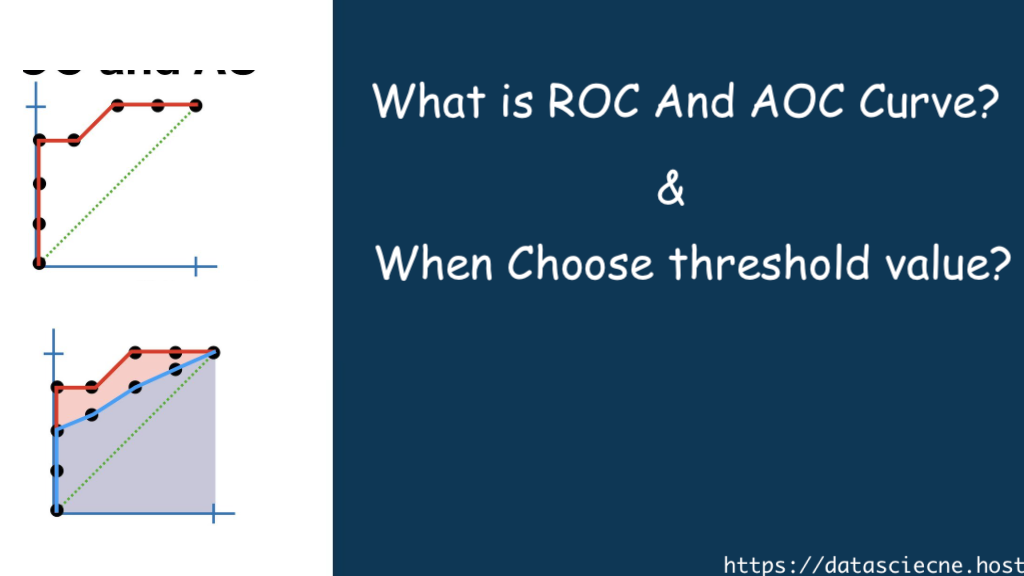
- The ROC Curve: This curve plots the true positive rate (TPR) on the y-axis against the false positive rate (FPR) on the x-axis. The TPR reflects the proportion of actual positives the model correctly identifies, while the FPR represents the proportion of healthy individuals wrongly classified as having the disease. An ideal ROC curve would hug the upper left corner of the graph, indicating a high TPR (correctly identifying most diseased individuals) with a low FPR (minimal misclassification of healthy individuals).
The Threshold Value: Setting the Bar
The ROC curve provides a valuable visual representation of the model’s performance across different threshold values. A threshold is a specific value on the test result spectrum that separates positive from negative predictions. For instance, in our medical test example, a threshold of 50 might signify that any test result value above 50 indicates the presence of the disease, while values below 50 suggest being healthy.
Here’s how the threshold value interacts with the ROC curve:
- High Threshold: A high threshold (e.g., only test results above 80 indicate disease) reduces the FPR (fewer false positives), but it might also decrease the TPR (missing some true positives).
- Low Threshold: Conversely, a low threshold (e.g., any test result above 20 indicates disease) increases the TPR (catching more true positives), but it can also lead to a higher FPR (more false positives).
AUC: A Single Score for Performance
The Area Under the Curve (AUC) simplifies the ROC curve by condensing its overall performance into a single numerical score between 0 and 1.
- AUC of 1: An ideal scenario, signifying perfect performance where the model flawlessly distinguishes between positive and negative cases.
- AUC of 0.5: Represents random guessing, where the model performs no better than chance in differentiating between the classes.
- AUC Values Between 0.5 and 1: The higher the AUC, the better the model’s ability to discriminate between positive and negative cases across various threshold values.
Utilizing ROC AUC and Threshold in Practice
By analyzing the ROC curve and AUC, you gain valuable insights into your model’s performance:
- Comparing Models: ROC curves and AUC allow you to compare the performance of different classification models on the same dataset. The model with the higher AUC generally exhibits superior classification ability.
- Fine-Tuning Thresholds: Understanding how the TPR and FPR change with different thresholds empowers you to select a threshold that best suits your specific needs. For instance, in a medical test, you might prioritize a low FPR (minimizing false positives) even if it means sacrificing some true positives (missing a few diseased individuals for further testing).
Practical Applications
The ROC AUC and threshold value transcend the realm of medical testing. They are invaluable tools for evaluating the performance of classification models in diverse domains, including:
- Fraud Detection: Classifying transactions as fraudulent or legitimate.
- Image Recognition: Distinguishing between different objects or scenes in images.
- Anomaly Detection: Identifying unusual patterns in data, such as cyberattacks in network traffic.
By effectively utilizing ROC AUC, threshold values, and other evaluation metrics, you can ensure that your classification models make reliable and accurate predictions, leading to optimal outcomes in various applications.
In Conclusion: A Powerful Trio for Classification Evaluation
ROC curves, AUC, and threshold value work together as a formidable force for evaluating the performance of classification models. By leveraging these concepts, you can gain a deeper understanding of how well your model distinguishes between different categories, empowering you to make informed decisions about its deployment and potential impact in real-world applications. As you delve deeper into the realm of machine learning, remember that mastering these evaluation techniques is vital for building robust and reliable classification models.