Business Objective :
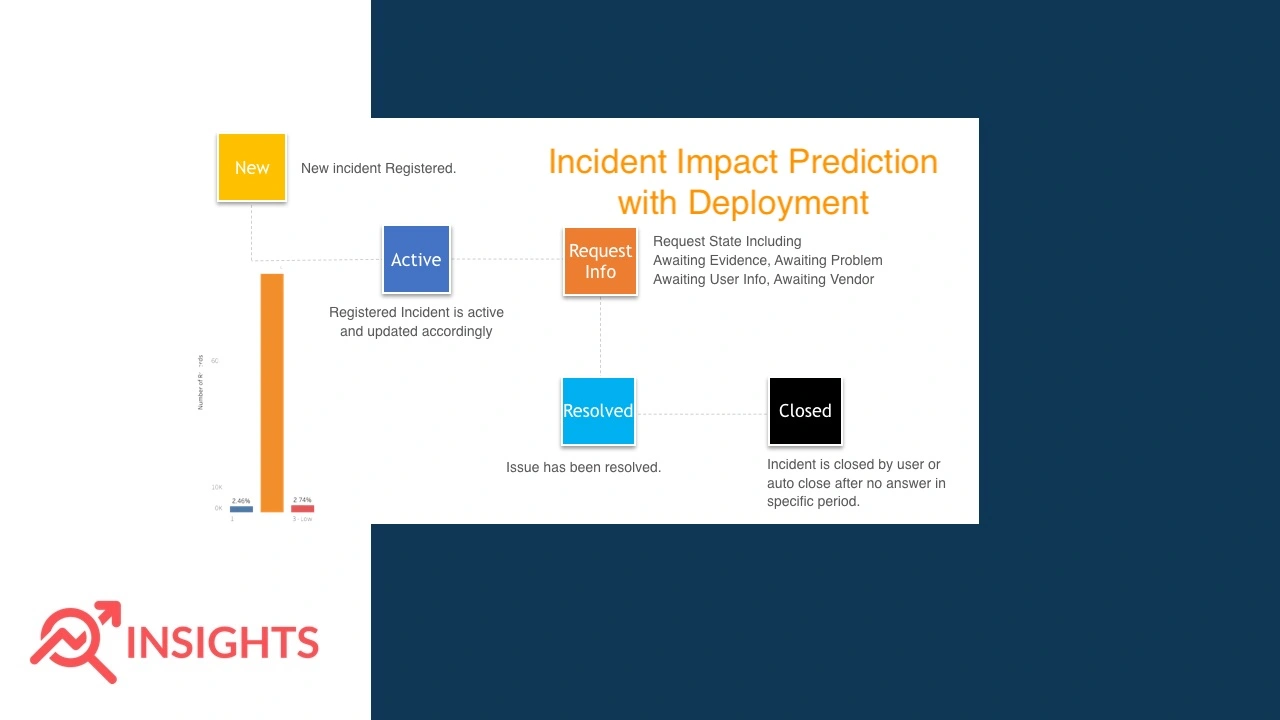
To Predict The Impact Of The Incident Raised By The Customer.

Data Set Details:
If You Need Data Set Then Mail Me
train This DataSet For View Purpose.
Note: In Data visualisation , I Use Tableau Software.
EDA
We Have Two Data Set File. test.csv And train.csv
dim(train) # Getting Dimensions of Data.
colnames(train)
str(train)
Convert Logical To Factor.
for (i in 1:ncol(train)){
if(class(train[,i])=='logical'){
train[,i] <- as.factor(train[,i])
}
}

for (i in 1:ncol(test)){
if(class(test[,i])=='logical'){
test[,i] <- as.factor(test[,i])
}
}
Data Cleaning & Imputation
table(train$impact)
table(train$ID_status)
train <- subset(train,train$ID_status!='-100')
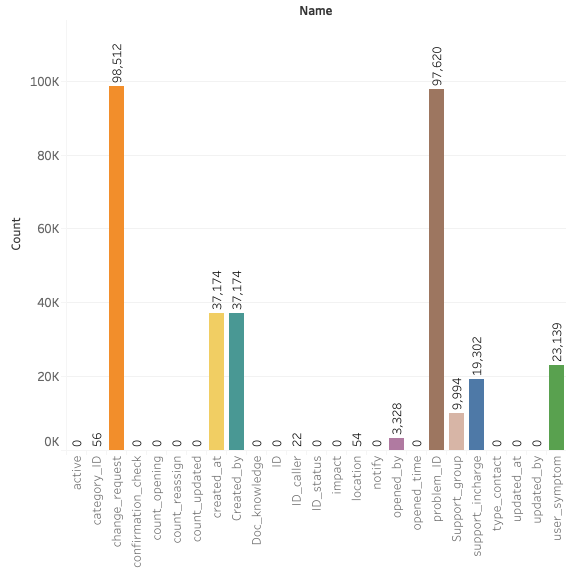
Removing Feature >50% data loss and timestamp.
colSums(train=='?')
train <- train[,-c(9,11,13,24,25)]

colSums(test=='?')
test <- test[,-c(9,11,13,23,24)]
Imputing With Mode which have lesser number of record missing.
train$ID_caller[train$ID_caller=='?'] <- 'Caller 1904'
train$location[train$location=='?'] <- 'Location 204'
train$category_ID[train$category_ID=='?'] <- 'Category 26'

test$ID_caller[test$ID_caller=='?'] <- 'Caller 1904'
test$location[test$location=='?'] <- 'Location 204'
test$category_ID[test$category_ID=='?'] <- 'Category 26'
Imputing With Decision Tree which have Large number of record missing.
sort(subset(colSums(train=='?'),colSums(train=='?')>1))
train[train=='?'] <- NA
train <- droplevels(train)
train <- impute(train,16,'opened_by')
train <- impute(train,16,'Support_group')
train <- impute(train,16,'support_incharge')
train <- impute(train,16,'user_symptom')
train <- impute(train,16,'Created_by')


sort(subset(colSums(test=='?'),colSums(test=='?')>1))
test[test=='?'] <- NA
test <- droplevels(test)
test <- impute(test,16,'opened_by')
test <- impute(test,16,'Support_group')
test <- impute(test,16,'support_incharge')
test <- impute(test,16,'user_symptom')
test <- impute(test,18,'Created_by')

#End of Emputation.
Load Imputed Train & Test Data
Then Compute Logical to Factor New Imputed Data
for (i in 1:ncol(train)){
if(class(train[,i])=='logical'){
train[,i] <- as.factor(train[,i])
}
}
for (i in 1:ncol(test)){
if(class(test[,i])=='logical'){
test[,i] <- as.factor(test[,i])
}
}
Feature Selection
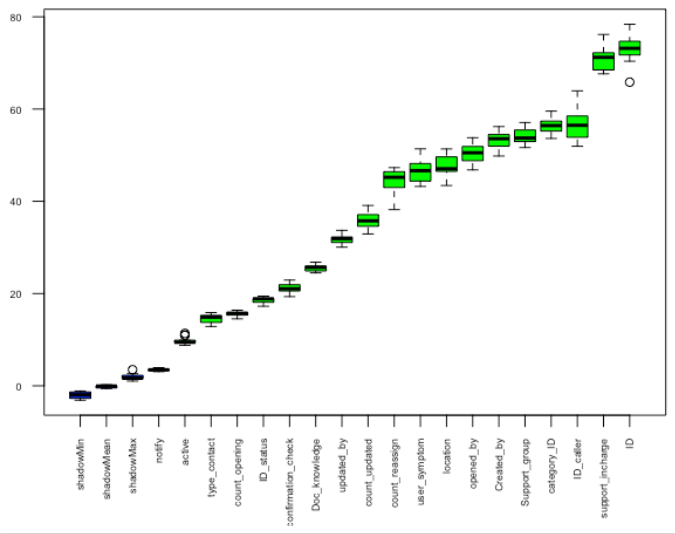
I Use Boruta Feature
#Fit boruta model
boruta_output <- Boruta(impact ~ ., data=train, doTrace=1,maxRuns=15)

#Saveing Improtance of variable
boruta_importance <- attStats(boruta_output)

#Plotting Variable improtance
plot(boruta_output, las = 2,cex.axis=0.55,xlab="")
attStats(boruta_output)

Factor Variable Encoding
train.impact <- train['impact']
train <- train[-20]
train['df_type'] <- 'train'
test['df_type'] <- 'test'
ori_data <- rbind(train,test)
ori_data <- droplevels(ori_data)

for (i in 1:ncol(ori_data)){
if(class(ori_data[,i])=='factor'){
ori_data[,i] <- as.numeric(ori_data[,i])
}
}

#Getting Train Dataset
train <- ori_data[ori_data$df_type=='train',]
train <- train[-20]
train['impact'] <- train.impact

#Getting Test Dataset
test <- ori_data[ori_data$df_type=='test',]
test <- test[-20]
Sampling Data Before Model Building
low <- subset(train,train$impact=='3 - Low')
medium <- subset(train,train$impact=='2 - Medium')
high <- subset(train,train$impact=='1 - High')

low <- low[sample(nrow(low), 94032,replace = T), ]
high <- high[sample(nrow(high), 94032,replace = T), ]
train <- rbind(low,medium,high)
Model Building
Decision Tree
library(C50)
controls <- C5.0Control(winnow = TRUE,
CF = 1,
fuzzyThreshold = FALSE,
sample = 0.999,
label = "impact")
train_model <- C5.0(train[,-which(colnames(train)=='impact')],train$impact,control = controls)
summary(train_model)
plot(train_model)
train_pred <- predict(train_model,train)
train <- sample_train
#Accuracy
library(caret)
confusionMatrix(train_pred,train$impact)


#Predicting On test Data

test_pred <- predict(train_model,newdata = test)
test_pred <- as.data.frame(test_pred)
test_pred['id'] <- 1:42514
colnames(test_pred) <- c('prediction1','ID')
test_pred <- test_pred[c('ID','prediction1')]
Random Forest
library(randomForest)
train_rand_forest <- randomForest(train[,-which(colnames(train)=='impact')],train$impact,mtry=7,ntree=1500,importance=TRUE)
summary(train_rand_forest)
train_rand_forest$importance
train_rand_pred <- predict(train_rand_forest,train)
#Accuracy
library(caret)
confusionMatrix(train_rand_pred,train$impact)

#Predicting On test Data

test_rand_pred <- predict(train_rand_forest,test)
test_rand_pred <- as.data.frame(test_rand_pred)
test_rand_pred['id'] <- 1:42514
colnames(test_rand_pred) <- c('prediction1','ID')
test_rand_pred <- test_rand_pred[c('ID','prediction1')]
Deployment R-Shiny
R Shine Deployment on Blow Link…..
R Shiny Code : Incident Impact Prediction
Python Deployment Using Flask
Deploy Model On Heroku Check Url Blow
Live Url : https://incident-impact-prediction.herokuapp.com
GitHub Full Code Link
Flask : https://github.com/jaydipkumar/flask
