Are you ready to harness the power of data science with Tableau? This powerful tool has revolutionized how we analyze and visualize complex datasets. In this guide, we’ll explore how Tableau in data science can transform raw data into actionable insights. Whether you’re a seasoned analyst or just starting out, you’ll discover why Tableau has become indispensable for data scientists.
Understanding Tableau’s Role in Data Science
Tableau isn’t just a visualization tool. It’s a data analysis powerhouse. Here’s why it’s crucial for data science:
- Data Exploration: Quickly analyze large datasets
- Visual Analytics: Create interactive dashboards
- Data Storytelling: Communicate insights effectively
At QuickInsights.org, we’ve seen how Tableau transforms raw data into clear, actionable information.
Getting Started with Tableau for Data Science
Beginning your journey with Tableau is straightforward. Here’s how to start:
- Download Tableau: Get the free trial or student version
- Connect Data: Link to your datasets or use sample data
- Explore Interface: Familiarize yourself with the workspace
Remember, practice makes perfect. Start with simple visualizations and work your way up.
Key Features of Tableau for Data Scientists
Tableau offers a range of features tailored for data analysis:
- Drag-and-Drop Interface: Create visualizations easily
- Data Blending: Combine multiple data sources
- Advanced Analytics: Use statistical tools and forecasting
- Geographic Mapping: Visualize spatial data
These features make Tableau a versatile tool for various data science tasks.
Data Preparation in Tableau
Good data analysis starts with proper preparation. Tableau helps you:
- Clean Data: Remove duplicates and fix errors
- Transform Data: Reshape and pivot your dataset
- Create Calculated Fields: Derive new insights from existing data
Clean data leads to more accurate analyses and visualizations.
Creating Powerful Visualizations
Tableau excels in creating compelling visualizations. Here are some popular types:
- Bar Charts: Compare categories
- Line Graphs: Show trends over time
- Scatter Plots: Identify correlations
- Heat Maps: Visualize data density
Experiment with different chart types to find the best fit for your data.
Advanced Analytics with Tableau
Tableau isn’t just for basic charts. It offers advanced analytics capabilities:
- Predictive Analytics: Forecast future trends
- Cluster Analysis: Identify groups in your data
- Time Series Analysis: Analyze patterns over time
These tools help data scientists extract deeper insights from their data.
Integrating Tableau with Other Data Science Tools
Tableau works well with other data science tools:
- R Integration: Use R scripts in Tableau
- Python Connection: Leverage Python’s data processing power
- SQL Queries: Write custom SQL for data retrieval
This integration enhances Tableau’s capabilities for complex analyses.
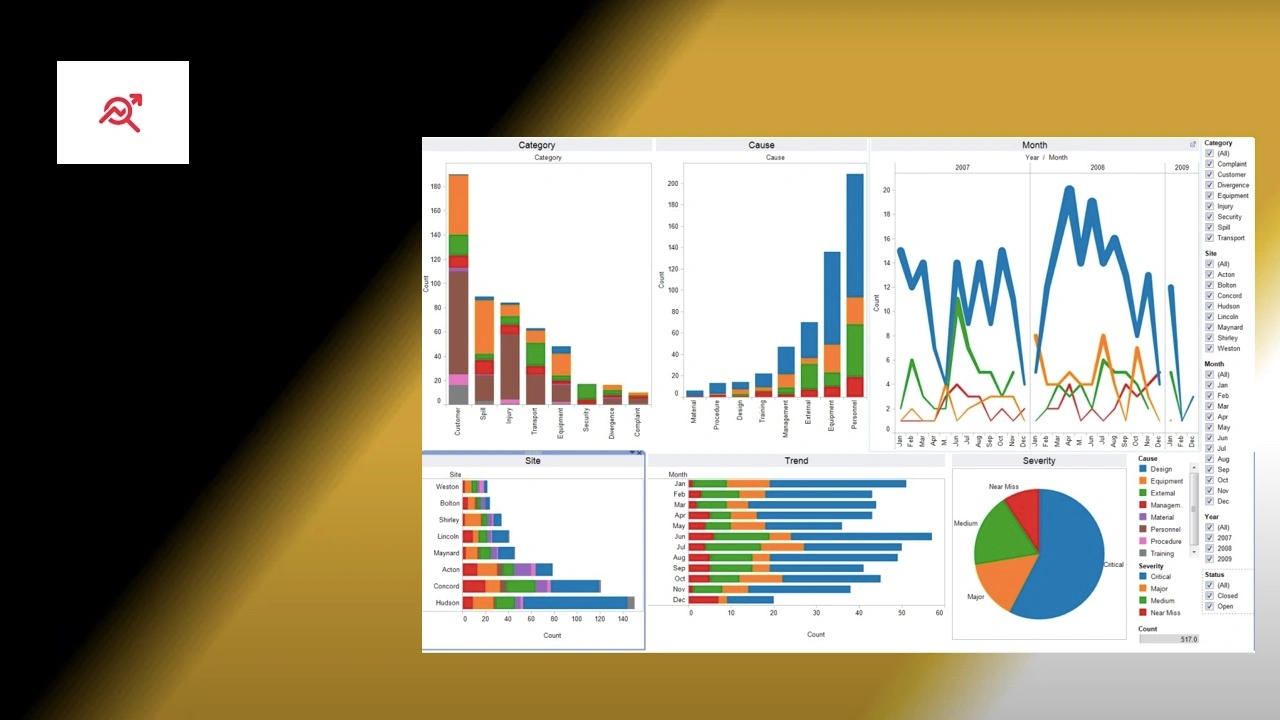
Building Interactive Dashboards
Dashboards are key for data communication. Here’s how to create effective ones:
- Layout Design: Arrange visualizations logically
- Interactivity: Add filters and parameters
- Performance Optimization: Ensure smooth user experience
Well-designed dashboards make data accessible to all stakeholders.
Data Storytelling with Tableau
Telling a story with data is crucial. Tableau helps you:
- Create Narratives: Guide viewers through your insights
- Use Annotations: Highlight key points in your visualizations
- Develop Storyboards: Present a sequence of visualizations
Effective storytelling turns data into actionable insights.
Best Practices for Data Science in Tableau
Follow these tips for success with Tableau:
- Start with Questions: Define your analysis goals
- Keep It Simple: Don’t overcomplicate visualizations
- Use Color Wisely: Enhance understanding, not just aesthetics
- Iterate and Refine: Continuously improve your work
These practices will help you create more impactful analyses.
Tableau for Big Data Analysis
Tableau can handle large datasets efficiently:
- Data Extracts: Create optimized data snapshots
- Live Connections: Connect directly to big data sources
- Incremental Refreshes: Update only new data
These features make Tableau suitable for big data projects.
Machine Learning Integration in Tableau
Tableau is expanding its machine learning capabilities:
- Automated Insights: Get AI-powered data explanations
- Model Integration: Use external ML models in Tableau
- Natural Language Processing: Ask questions in plain English
These advancements bring ML closer to everyday data analysis.
Real-World Applications of Tableau in Data Science
Tableau is used across industries for data science:
- Finance: Risk analysis and fraud detection
- Healthcare: Patient outcomes and resource allocation
- Retail: Customer behavior and inventory management
- Education: Student performance and resource utilization
These examples show Tableau’s versatility in solving real-world problems.
Future Trends in Data Science with Tableau
The future of Tableau in data science looks promising:
- AI-Driven Analytics: More automated insights
- Enhanced Collaboration: Better team-based analysis tools
- Improved Data Governance: Stronger data management features
Stay updated with these trends to remain competitive in the field.
Conclusion: Mastering Data Science with Tableau
Tableau has become an essential tool for data scientists. Its combination of powerful analytics and user-friendly interface makes it ideal for turning data into insights. By mastering Tableau, you’ll enhance your data science skills and become a more effective analyst. Keep practicing, stay curious, and let Tableau help you unlock the stories hidden in your data.